- The 2024 researchers withheld brand names on the record, and said why. They wanted more samples and more brands before singling anyone out. So the 240,000 figure belongs to three anonymous brands, not to any bottle you can buy by name.
- At least one popular site publishes six-figure per-brand numbers and credits them to that study by name. Those brands were never in its cohort. We show the specific rows below.
- The one study that looked for between-brand differences did not find any. A 2024 UK study measured 17 named brands and reported no statistically significant difference, which undercuts the premise of ranking tables entirely.
Why can nobody give you a straight brand ranking?
Because the study that produced the frightening number refused to produce the names, and it did so on purpose.
The demand is obvious. People search for the worst bottled water brands for microplastics, for a list, for which brand is safe. The supply has appeared to meet it. What has not appeared is the underlying data, because it does not exist in the form those pages imply.
What follows is what was actually measured, by whom, and in what units, so you can tell a real number from an invented one.
What did the 2024 study actually find?
The paper is Qian and colleagues, published in PNAS in January 2024, from Columbia University and Rutgers. It used a laser imaging technique called stimulated Raman scattering, which can see particles down to about 100 nanometres. That is far smaller than anything earlier bottled-water studies could detect, and it is why the headline number was so much larger than anything before it.
The finding: about 240,000 particles per litre, in a range from 110,000 to 370,000, of which roughly 90 percent were nanoplastics rather than microplastics.
Now the part that the coverage mostly skipped. The study tested five bottles. They came from three brands. The researchers declined to say which three.
This was not an oversight. Columbia’s own announcement stated that the researchers tested three popular brands sold in the United States “(they declined to name which ones)”. A study author explained the reasoning to the Associated Press:
She wouldn’t reveal the three brands because researchers want more samples before they single out a brand and want to study more brands.
That is a scientist being careful with a small sample. It is also, unavoidably, a dead end for anyone wanting a brand ranking out of this paper. Three unnamed brands and one aggregate figure cannot become a per-brand table no matter how the number is presented.
So where do the brand names come from?
From a completely different study, six years earlier, measuring particles more than fifty times larger.
Mason, Welch and Neratko published in Frontiers in Chemistry in 2018, funded by Orb Media, from the State University of New York at Fredonia. It tested 259 bottles across 11 named brands from 19 locations in 9 countries. It is open access, so you can read the tables yourself.
This study did name brands. Here is the actual per-brand data.
| Brand | Particles/L above 100 µm (confirmed as plastic) |
Particles/L 6.5–100 µm (probable, dye-based) |
|---|---|---|
| Nestlé Pure Life | 19.6 | 1,245 |
| Gerolsteiner | 11.9 | 796 |
| Bisleri | 9.14 | 348 |
| Epura | 10.0 | 238 |
| Aquafina | 13.2 | 200 |
| Aqua | 7.71 | 174 |
| Evian | 13.8 | 146 |
| Dasani | 10.4 | 109 |
| Wahaha | 6.34 | 90 |
| Minalba | 4.29 | 59 |
| San Pellegrino | 1.68 | 28.6 |
Across all bottles the average was 10.4 particles per litre above 100 microns, plus 315 in the smaller band, for 325 total. 93 percent of bottles showed some contamination.
Two things about this table matter enormously and are almost always dropped.
First, only the larger particles were confirmed to be plastic. The authors are explicit that for the 6.5 to 100 micron fraction, spectroscopic analysis was not possible, and that the dye result indicates those particles are “most probably” plastic. That is a hedge the researchers wrote and most republishers delete. The right-hand column of the table above is the less certain column.
Second, these are microplastics, not nanoplastics. The detection floor was 6.5 microns. The 2024 study counted particles at 100 nanometres, which is sixty-five times smaller. The two studies were not looking for the same thing, and their numbers are not on the same scale.
The study that names brands and finds the ranking pointless
There is a second brand-named dataset, and its result is the most useful thing in this entire subject.
Al-Mansoori and colleagues, published in Emerging Contaminants in 2024, tested 85 samples across 17 named UK-market brands, five samples each. Evian, Voss, Fiji, Hildon, Belu, Brecon Carreg, Marks & Spencer, Princes Gate, Radnor Hills, Strathmore and others. The mean was 37 plus or minus 11 particles per litre, with a range from 12 to 62.
Here is the finding that matters: the authors found no statistically significant difference between the brands. Not a small difference. No significant difference at all.
Read that against what brand ranking tables assert. They exist to tell you that some brands are meaningfully worse than others. A study that named 17 brands, measured them properly, and then reported that brand identity does not predict contamination is direct evidence against that premise.
It fits what the underlying science would predict. If particles are shedding from PET bottles, caps and the bottling process itself, then the variable is packaging and handling, not the label on the front. Two brands using the same bottle supplier and the same line have no particular reason to differ.
This is why we say the 2018 data does not support a stable ranking either. Its spread between brands came from one sampling round. When a later study looked specifically for between-brand differences, it did not find them.
What does a fabricated brand table look like?
Concrete, because this is checkable.
The site microplasticsapp.com publishes a bottled water brand database. Two of its rows:
| Brand | Figure published | Source column states |
|---|---|---|
| Aquafina | ~200,000–270,000 / L | “PNAS 2024 (Qian)” |
| Dasani | ~180,000–250,000 / L | “PNAS 2024 (Qian)” |
Neither Aquafina nor Dasani was in that study’s cohort. The study named no brands at all and reported a single aggregate figure. Those per-brand ranges appear in no published research. They are attributed by name to a real, checkable citation that does not contain them.
The same page’s stated method is that where a brand appeared in either study’s cohort, the cited number is used directly. The 2024 cohort was three unnamed brands, so no brand can be matched to it. And the same database scores that site’s own house-brand water inside the fabricated dataset.
The same operator’s ranking article demonstrates the mechanism even more clearly. It states the limitation correctly, that the 2024 study did not name brands. Then, further down the same page, it asserts that “every brand tested averaged 240,000 nanoparticles per litre” and that all PET-bottled brands carry roughly that figure. Its own two pages disagree with each other about Dasani by a factor of well over a hundred.
Elsewhere, lowtoxgear.com puts Dasani above 300,000 particles per litre, citing unspecified 2026 lab testing. That matches neither study. It is published inside FAQ structured data, which is the format search engines and AI assistants lift most readily into direct answers, so a number with no traceable origin propagates efficiently.
Why is ranking these numbers meaningless?
Because a sortable column requires comparable units, and these are not comparable.
Put roughly 200,000 per litre next to roughly 325 per litre and the first looks catastrophic. But one counts particles down to 100 nanometres using laser imaging, and the other counts particles down to 6.5 microns using a fluorescent dye. Different size classes, different instruments, different detection limits.
A study that can see smaller particles will always count more of them. That is not a finding about the water. It is a fact about the microscope.
So when a table sorts brands into best and worst using a mix of both, the ordering is produced by which study a row was taken from. It tells you nothing about which bottle is cleaner.
This problem is not confined to brand tables
While researching the filtration section of this article, we hit the same failure mode twice more.
Two claims circulate widely as established fact. One is a 2019 study showing reverse osmosis removes 99.9 percent of microplastics. The other is a 2024 paper in Nature Nanotechnology establishing that RO is the only household technology that removes particles below 100 nanometres.
Neither paper exists. The first appears across vendor blogs with no author, no volume and no DOI. The second is a garbled retelling of the 2024 PNAS bottled-water study, which is about detection methodology rather than household filtration, and which actually identified an RO membrane as a particle source.
That is the same mechanism as the brand tables: a real-sounding citation attached to research that says something else, or to no research at all. It is worth knowing that it runs through the filtration advice as thoroughly as it runs through the brand rankings, because the filtration advice is what most people act on.
What is actually known about the health risk?
Less than the coverage suggests, and this deserves stating plainly.
The World Health Organization assessed microplastics in drinking water in 2019 and judged the risk to be of low concern, while stressing that the evidence base was limited. A 2022 follow-up still found knowledge gaps that prevented a definitive assessment.
A toxicologist on the 2024 study told the Associated Press:
That’s currently under review. We don’t know if it’s dangerous or how dangerous.
Harm is not established. Exposure is established, and the two are different claims. A separate 2024 Spanish study of five brands, which anonymised them as Brand 1 to Brand 5, concluded that bottled water probably represents a negligible risk to human health.
Anyone telling you a specific brand is dangerous is ahead of the science in both directions: ahead on the brand attribution, and ahead on the harm.
What actually reduces your exposure?
Here the evidence is more useful, with real caveats.
Switching from bottled to tap
This is the largest single lever. Cox and colleagues estimated annual intake at roughly 90,000 microplastic particles from bottled water against about 4,000 from tap water. The authors caution these are order-of-magnitude comparisons rather than precise counts, but the direction is not in doubt.
Boiling, but only if your water is hard
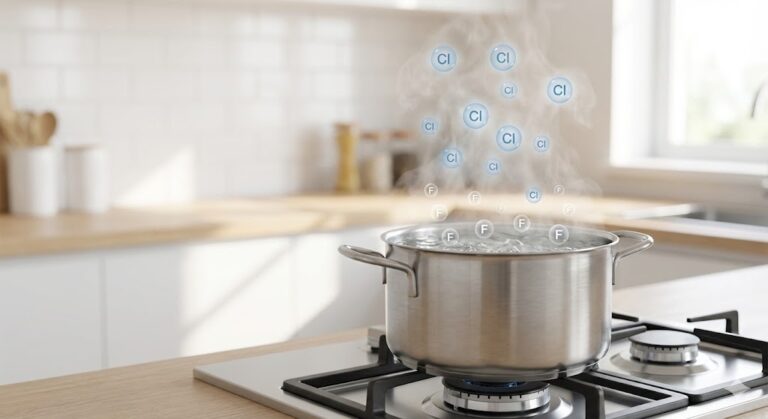
A 2024 study in Environmental Science & Technology Letters found that boiling hard water removed up to about 90 percent of nano and microplastics, because calcium carbonate forms and traps the particles, which can then be filtered out.
The catch is significant. In soft water, below 60 mg/L, removal was only about 25 percent. A published comment on the study notes that hardness varies dramatically by region and that a water softener or purifier removes the very minerals the effect depends on. This works for some households and barely at all for others.
Note also that boiling alone does not remove anything. It concentrates the particles in the pot. The removal step is filtering after the water cools.
Reverse osmosis, which performs well but not perfectly
The common argument for RO is theoretical: membrane pores are around 0.1 nanometres, far smaller than any plastic particle, so nothing should pass. Measured results do not match that implied perfection.
Published figures span a wide band. A 2025 study in Desalination found whole-plant removal of 83 to 99.5 percent with the RO stage reaching 99.9 percent, but also found that downstream remineralisation reintroduced particles, up to 191 per kilogram of calcite added. A 2025 synthesis in Membranes collecting primary studies reports ranges of 93.2 to 98.0 percent, 90.45 percent for larger particles, and as low as 63.5 percent in some measurements, and documents genuine breakthrough with fibres found in post-RO water.
So RO is strong, with a realistic range of roughly 63 to 99.9 percent depending on the system and what is measured. It is not the absolute barrier it is often sold as.
Two further points are worth knowing. RO membranes are made of polyamide, and polyamide was the dominant polymer the 2024 study found; its lead author stated the plastic appears to come from the bottle itself and the reverse osmosis membrane filter used in bottling. And RO is not the only technology that works: a 2025 study in npj Clean Water found ten full-scale plants using granular media, ultrafiltration and microfiltration with no RO at all achieving above 97.5 percent.
Activated carbon, where the mechanism is misunderstood
Carbon filters do remove particles, but not by adsorption, which is what the marketing implies. Granular activated carbon pores are around 1.88 nanometres, smaller than the particles themselves. Removal happens by mechanical entrapment.
That distinction has a consequence: performance degrades as the filter loads. One 2023 study measured removal falling from 95.5 percent to 59.2 percent as particle concentration rose. More concerning, a 2023 study in Polymers found that some point-of-use carbon and ion-exchange devices produced effluent counts higher than influent, meaning the device was shedding particles of its own.
What certification does and does not cover
NSF/ANSI 401 includes a microplastics claim: 85 percent reduction of particles in the 0.5 to 1 micron range.
That 0.5 micron floor is about five times larger than the 100 nanometre particles the 2024 study counted. A filter certified for that claim is not certified against nanoplastics, and no consumer certification currently is. If nanoplastics are your specific concern, no product on the market carries a certified claim addressing them.
Municipal-scale treatment does better. Sand and granular activated carbon achieved about 88 percent nanoplastic removal, rising to 99.4 percent with coagulation, but that is a treatment plant, not a pitcher.
Frequently asked questions
Which bottled water brand has the most microplastics?
No study supports a confident answer. The 2018 Mason study found Nestlé Pure Life highest at 19.6 particles per litre in the confirmed size class and San Pellegrino lowest at 1.68, but that is one sampling round. A 2024 UK study of 17 named brands looked specifically for between-brand differences and found none that were statistically significant.
Do some bottled water brands really have fewer microplastics?
The best available evidence says brand is not the useful variable. A 2024 study of 17 named UK brands, five samples each, found no statistically significant difference between them. That fits the mechanism: particles shed from bottles, caps and the bottling process, so packaging and handling matter more than the label.
Did the 240,000 particles study name the brands?
No. The 2024 PNAS study tested five bottles from three brands and the researchers explicitly declined to name them, stating they wanted more samples and more brands before singling anyone out. Any per-brand figure attributed to that study is invented.
Why do brand lists show 200,000 particles for Aquafina and Dasani?
Because those sites have attached the 2024 aggregate nanoplastics figure to brand names from a different study. Neither brand was in the 2024 cohort. At least one site publishes such figures with the 2024 paper named in its source column, which is a citation to research that does not contain those numbers.
Is bottled water worse than tap water for microplastics?
The evidence says yes, substantially. One estimate puts annual intake at roughly 90,000 particles from bottled water against about 4,000 from tap. The authors treat these as order-of-magnitude figures rather than precise counts.
Are microplastics in bottled water dangerous?
Not established. The WHO assessed the risk as low concern in 2019 while noting limited evidence, and a 2022 review still found gaps preventing a definitive assessment. A toxicologist on the 2024 study said plainly that we do not know if it is dangerous or how dangerous. Exposure is documented; harm is not.
Does boiling water remove microplastics?
In hard water, up to about 90 percent, because calcium carbonate traps the particles and they can then be filtered out. In soft water below 60 mg/L, only about 25 percent. Boiling alone does not remove anything; the removal step is filtering after the water cools.
Does a filter remove nanoplastics?
No consumer filter carries a certified claim for nanoplastics. NSF/ANSI 401’s microplastics claim covers 0.5 to 1 micron particles, roughly five times larger than the nanoplastics counted in the 2024 study. Reverse osmosis performs well in measurements, though the published range is wide, roughly 63 to 99.9 percent, rather than the near-total removal often claimed.
What is the difference between microplastics and nanoplastics?
Size, and it changes everything about the numbers. The 2018 study detected particles down to 6.5 microns. The 2024 study detected them down to about 100 nanometres, sixty-five times smaller. Instruments that see smaller particles count far more of them, which is why the two studies’ figures differ by orders of magnitude.
Is the 240,000 figure reliable?
It is contested. A 2024 comment in PNAS argued that the treatment of procedural blanks made the quantitative assessment fundamentally unreliable. The authors replied defending their method and did not revise the figure. The disagreement is unresolved in the literature.
Which bottled water has no microplastics?
None has been shown to be free of them. The 2018 study found contamination in 93 percent of the 259 bottles it tested. Glass bottling changes the profile but does not eliminate particles, and some German research found higher counts in returnable glass than in single-use plastic.
Why do researchers avoid naming brands?
Scientific caution with small samples, and legal exposure. The 2024 team tested five bottles and said they wanted more data before singling out any brand. A 2024 Spanish study of five top-selling brands anonymised them as Brand 1 through Brand 5. Naming brands, as the 2018 study did, is the exception rather than the norm.
Should I stop drinking bottled water?
That is your call, and the honest input is this: bottled water carries substantially more plastic particles than tap water, and whether that causes harm is not established. If you want to reduce exposure with high confidence, drinking filtered tap water does more than choosing between bottled brands on the basis of rankings that are not supported by data.
Related reading
- NSF/ANSI 42 vs 53 vs 58 vs 401: what each certification covers
- How to test water quality at home
- Well water testing cost by state (2026)
- Best water testing kits, ranked
- Does Brita remove copper? The cheaper filter is the one that does
Sources
- Qian, N., Gao, X., Lang, X., Deng, H., Bratu, T.M., Chen, Q., Stapleton, P., Yan, B., & Min, W. (2024). Rapid single-particle chemical imaging of nanoplastics by SRS microscopy. PNAS, 121(3), e2300582121.
- Materić, D. (2024). Nanoplastics measurements must have appropriate blanks. PNAS, 121(48), e2411099121. And the authors’ reply, PNAS, 121(48), e2415874121.
- Mason, S.A., Welch, V.G., & Neratko, J. (2018). Synthetic Polymer Contamination in Bottled Water. Frontiers in Chemistry, 6:407.
- Al-Mansoori, M., Stephenson, S., Harrad, S., & Abdallah, M.A.-E. (2024). Synthetic Microplastics in UK tap and bottled water; Implications for human exposure. Emerging Contaminants, 11(1), 100417. 17 named UK brands, no statistically significant difference between them.
- Cox, K.D., et al. (2019). Human Consumption of Microplastics. Environmental Science & Technology, 53(12), 7068–7074. The bottled-versus-tap multiplier is a modelled estimate from heterogeneous literature; the direction is robust, the exact figure approximate.
- Barrientos-Riosalido, A., et al. (2025). Desalination, 615, 119329, on RO plant removal and remineralisation reintroducing particles.
- Bodzek, M., & Bodzek, P. (2025). Membranes, 15(3), 82, synthesis of RO removal ranges and documented breakthrough.
- Balkenbusch, M., et al. (2025). npj Clean Water, 8(1), 103, on non-RO full-scale plants exceeding 97.5 percent removal.
- Napi, N.N.L.M., et al. (2023). Bioengineered, 14(1), 2276391, on activated carbon removal degrading with load.
- Cherian, A.G., et al. (2023). Polymers, 15(6), 1331, on point-of-use devices producing effluent counts exceeding influent.
- Yu, Z., Wang, J.-J., Liu, L.-Y., Li, Z., & Zeng, E.Y. (2024). Drinking Boiled Tap Water Reduces Human Intake of Nanoplastics and Microplastics. Environmental Science & Technology Letters, 11(3), 273–279, together with the published comment and response.
- Gálvez-Blanca, V., et al. (2024). Scientific Reports, 14:11089, on Spanish bottled water brands, anonymised.
- Oßmann, B.E., et al. (2018), Water Research; and Schymanski, D., et al. (2018), on German bottled water by packaging type.
- World Health Organization, Microplastics in drinking-water (2019), and its 2022 follow-up review.
- Columbia University press announcement of the Qian et al. study, and Associated Press interview coverage, January 2024.